Store Performance Report
Are you the head of retail? Reports let you keep an eye on store performance.

Description:
The main advantage of this report is that you can see at a glance how well individual branches are meeting the monthly budget and KPIs.
A single report contains data on sales, predictions, availability of inventory, visit numbers and customer conversion ratio.
Reports help you to prevent goods being sold out and allow you to respond in time to trends in store visits and demand for goods. This overview helps store managers to achieve higher margins and sales.
Benefit:
Prevention of goods being sold out and a faster response to trends in demand for goods can help a store manager achieve higher margins and revenue.
Who it’s for: The report is intended for store managers, retail managers, CFOs, COOs and CEOs who are responsible for branches’ KPIs.
Ordered by: Head of retail, CFOs, COOs and CEOs
Return:
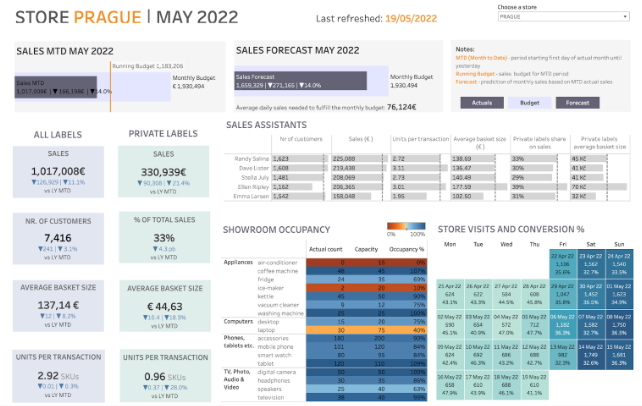
150 store managers spent at least an hour a week processing notifications. The estimated instant return was therefore up to 1 million CZK p.a. in savings on employee time – and that doesn’t include the benefit the report had in keeping managers informed, the overview of expectations and on managers’ motivation.In the middle part you can see the sales forecast at the end of the month at the current growth rate in sales, which helps you to respond quickly to a specific situation.
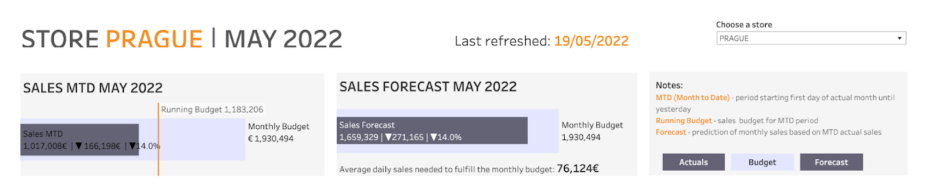
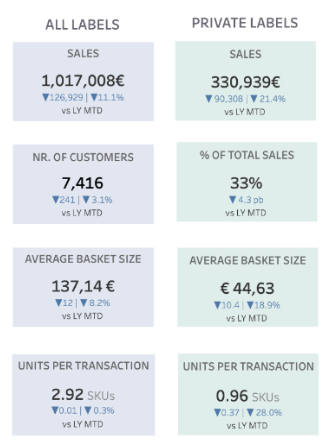
An overview of sales, margins and average transactions according to your needs. A specific customer wanted to get an overview of sales, divided according to the individual brands owned by the company.
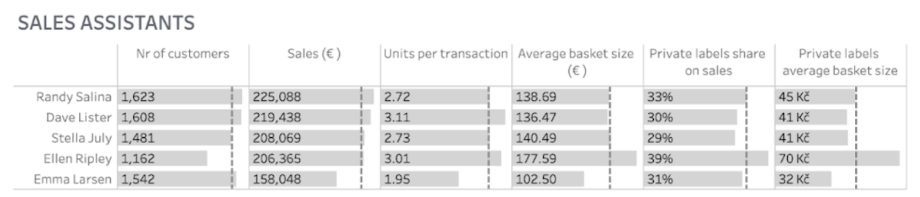
In the Sales Assistants section, you get an overview of the performance of individual sales assistant. This report can then be connected to a calculation of motivational bonuses for individual sales assistants.
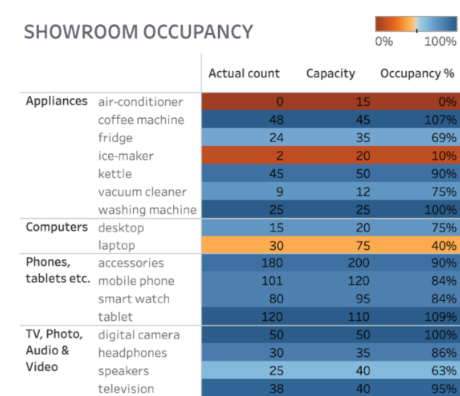
In the Showroom Occupancy section, you can see the stock availability on shelves/items at the store. Depending on the status, you can then stock up on items that will soon sell out. To go with this report, we recommend also using the stock availability report, which connects your branches to the central warehouse and recommends the best way to stock up on the item in question.
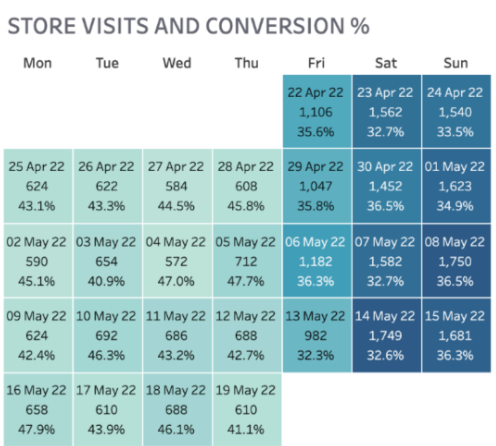
This specific client also wanted to monitor store visits, so we connected to their internal system and visualized the visit number vs. sales conversion on a particular day. Based on this metric the client was able to evaluate, for example, the success of a campaign at relevant stores. It was also able to carry out a quick evaluation of the suitability of a branch’s location and its return.
Whole report:
Try out the possibilities for commercial reports for companies in retail, what all you need to track and what information you can get to find out the status of every store.
Revolt Story:
The implementation of the dashboard for a large retail company with sales totalling 1.3 billion CZK significantly increased the performance of its 200 branches. The dashboard’s visualizations for store managers helped them to better manage their team based on current, daily data.
Thanks to the report the company was able to save approx. 1,170,000 CZK on employee time alone. And then there’s the financial benefit resulting from decisions made based on information in the report.