Keep an eye on your company’s financial health and performance
Clear information on your company’s performance.
Popis:
The dashboard gives you clear information on your company’s performance and on how it is meeting its targets in multiple areas, for example: overall sales, margins, performance, sales channels, store type and performance of area managers.
All of these metrics allow users to check their performance against the plan every day.

Who it’s for: For the top management of all retail and production companies that want to keep an eye on their KPIs and financial performance.
Ordered by: CFO, COO and CEO, and all employees responsible for the company’s KPIs, revenue or sales.
Return/Revolt Story:
Revolt BI implemented this dashboard for a large retail player on the CZ & SK market with revenue of 1.3 billion CZK p.a. and 200 retail outlets.
The dashboard visualizes the performance of the whole company and allows any CxOs to make decisions based on daily information. The new management of the company in which we implemented the report was able to quickly identify issues with high potential benefits and this initiative led to a 15% increase in income and cost savings of over 23 million CZK during the first months of implementation.
What you will find in the report: (report breakdown)
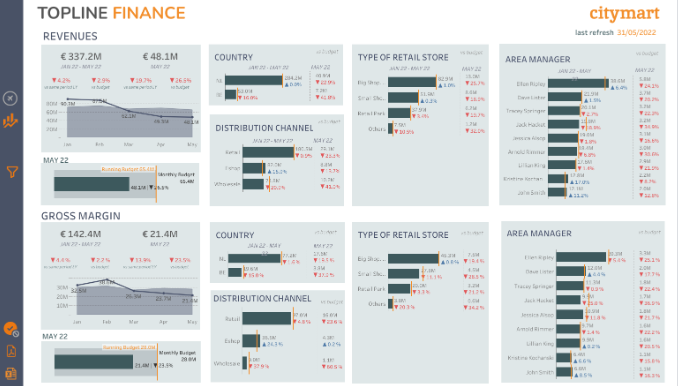
Overview of the most important metrics right at the top of the report.
Comparison of actual income during the selected period, and in the background a comparison showing results over the same period in the previous year. Under the first graph is a practical overview of income in the current month. The same visualization is available for sales.
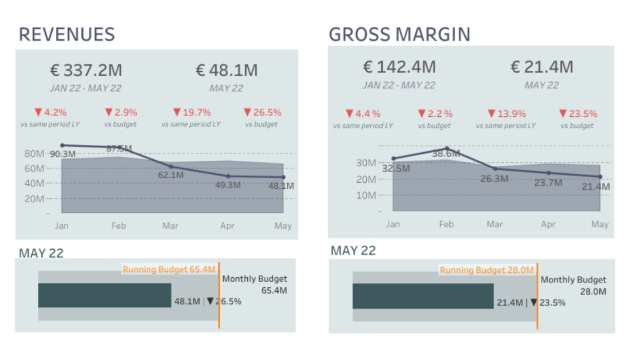
Depending on the individual needs of the customer, the report can also include a calculation of net profit, headcount or show store visit numbers vs. conversion.
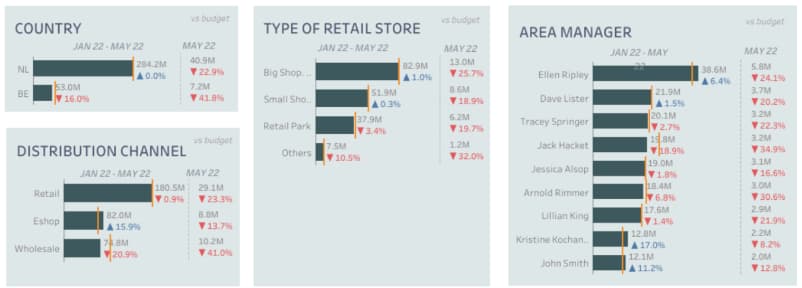
The following paragraphs show individual categories of revenue and sales in varying dimensions. Comparisons can be made between countries or wholesale vs. retail.
Mějte přehled o výkonu svých vedoucích prodejen včetně nastavených budgetů v sekci Area manager. Můžete porovnávat i s minulými lety/měsíci. Přes tržby i revenue. Tento report se dá následně napojit na systém odměňování nebo bonusů a ulehčí vyhodnocování KPIs.