Stock Availability Report
Keep an eye on overstock and understock
Description:
Keep an eye on all goods both at the warehouse and in branches with a single report.
For individual items you immediately see a recommendation for where to get more goods from, either from the central warehouse or if it’s better to have it distributed from another store.
Every day you see where you need to stock up and what the minimum required stock per store is. Calculations also take store prioritization into account so that you can get products to the store where they really are profitable.
Who it’s for:
Intended for purchasers or anyone who needs to keep an eye on warehouse stocks. The report can be e-mailed at regular intervals with individual adjustments adapted to the relevant purchaser.
Ordered by: Company management, purchasers.
Return:/Revolt Story:
In the case of a client with revenue of more than a billion crowns p.a., Revolt BI prepared an analysis for stock availability reports. The data showed that poor placement of goods at stores had caused loss of profit amounting to approx. 3,500,000 CZK p.a. compared to the previous year. One of the main reasons for the fall in profits was the reduced diversity of the range offered at stores, even though products were available at the central warehouse.
Thanks to the report, the customer had access to clear data about how to reduce loss of profit by 2,000,000 CZK per month with proper warehousing of its bestselling products.
What you will find in the report: (report breakdown)
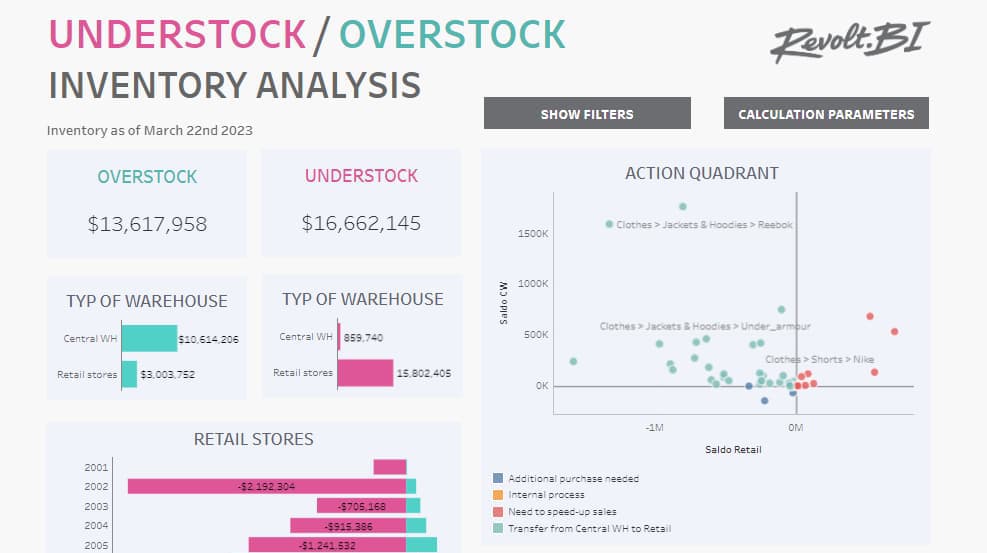
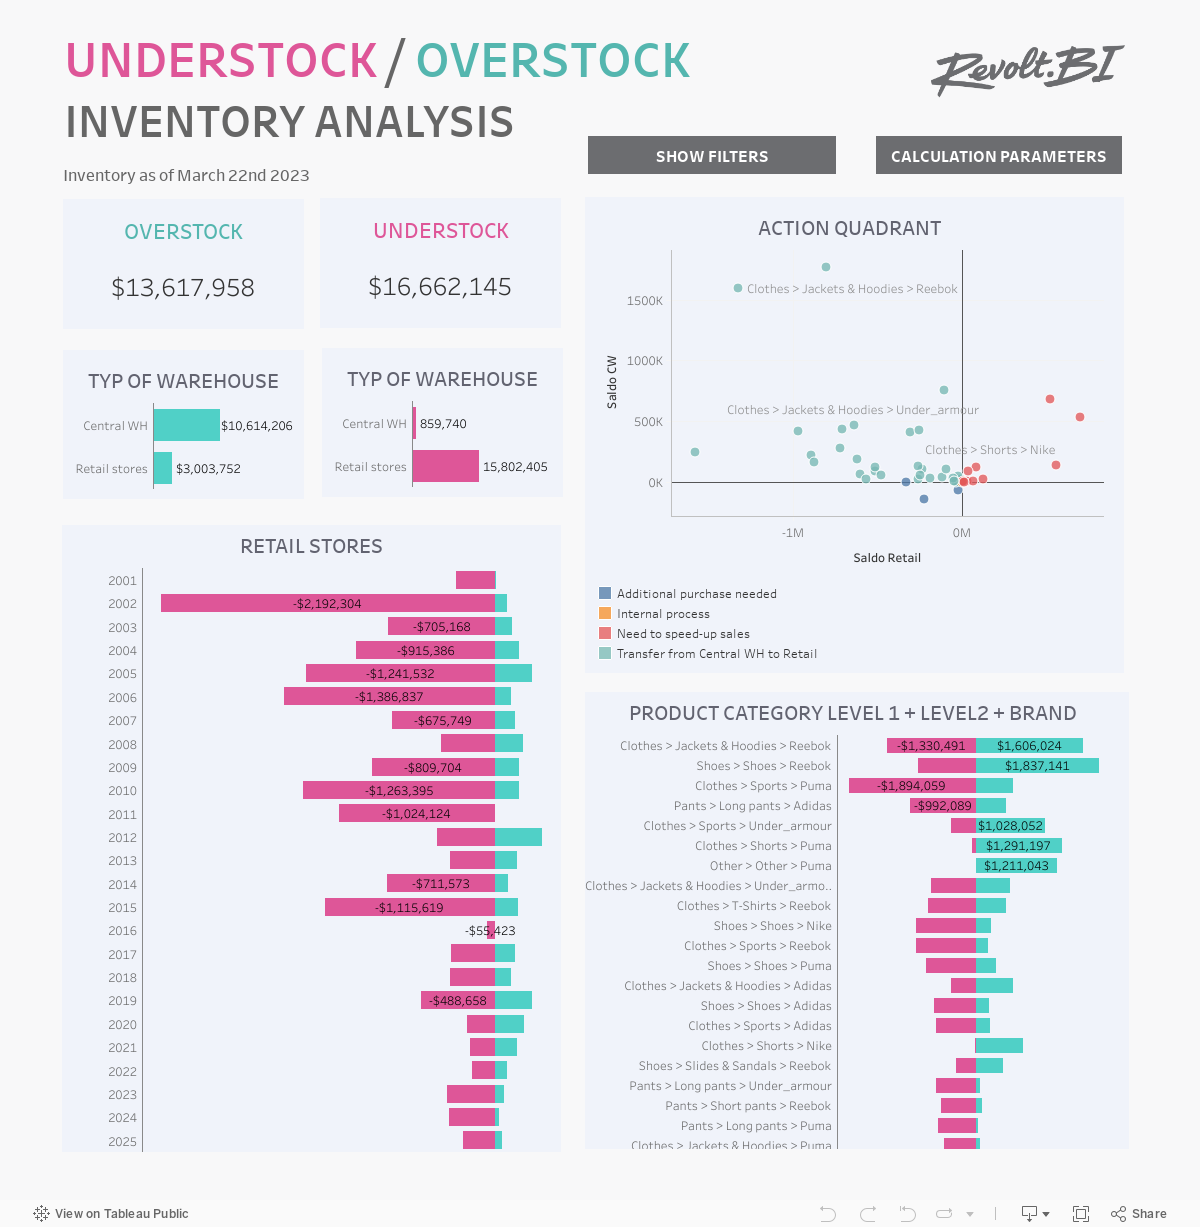
The report is divided into two sections. The upper section of the report contains an overview of products and the lower section a breakdown of stock availability by store.
An overview of percentage stock availability vs. percentage of optimal stock availability of a product shows the status of store stocks.
Average sales figures, according to which the recommended minimum stock availability of a product is adjusted, are calculated on the basis of historical data on sales for a selected time frame (30 days/90 days or a year).
Users can use the parameter settings to adjust the time they want to have stocks of a product available for. The report also includes the maximum capacity of the relevant store so that stores don’t needlessly tie up money in the warehouse when capacity is limited.
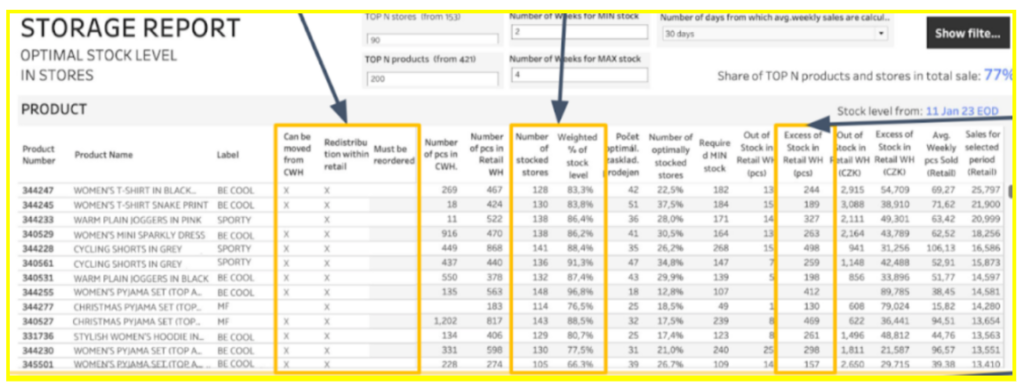
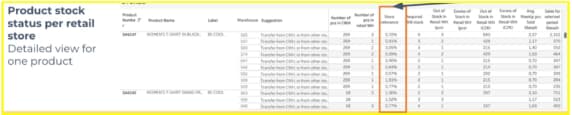
The product view shows the stock availability status of a product at all stores and whether there’s an excess of it, or where missing goods can be supplied from – either from the central warehouse, another store, or whether it is recommended to buy it directly from the supplier.
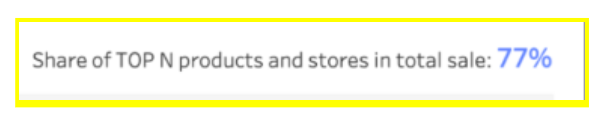
Use the filter to select the top N stores that you’re interested in. The proportion of N monitored products to sales is then expressed as a percentage in the corner.
The stores view also lists the weighting of a store, i.e., which store is to take priority in stocking-up.
Our reports also include a Data Quality control section as standard. The table, which shows you inputs from various source systems, helps you to determine whether data is being fed into the report or something’s gone wrong. And if that happens, we’re here for you to and can make a quick intervention to fix the problem.